Events
What I learned hosting Hack for Humanity in San Francisco
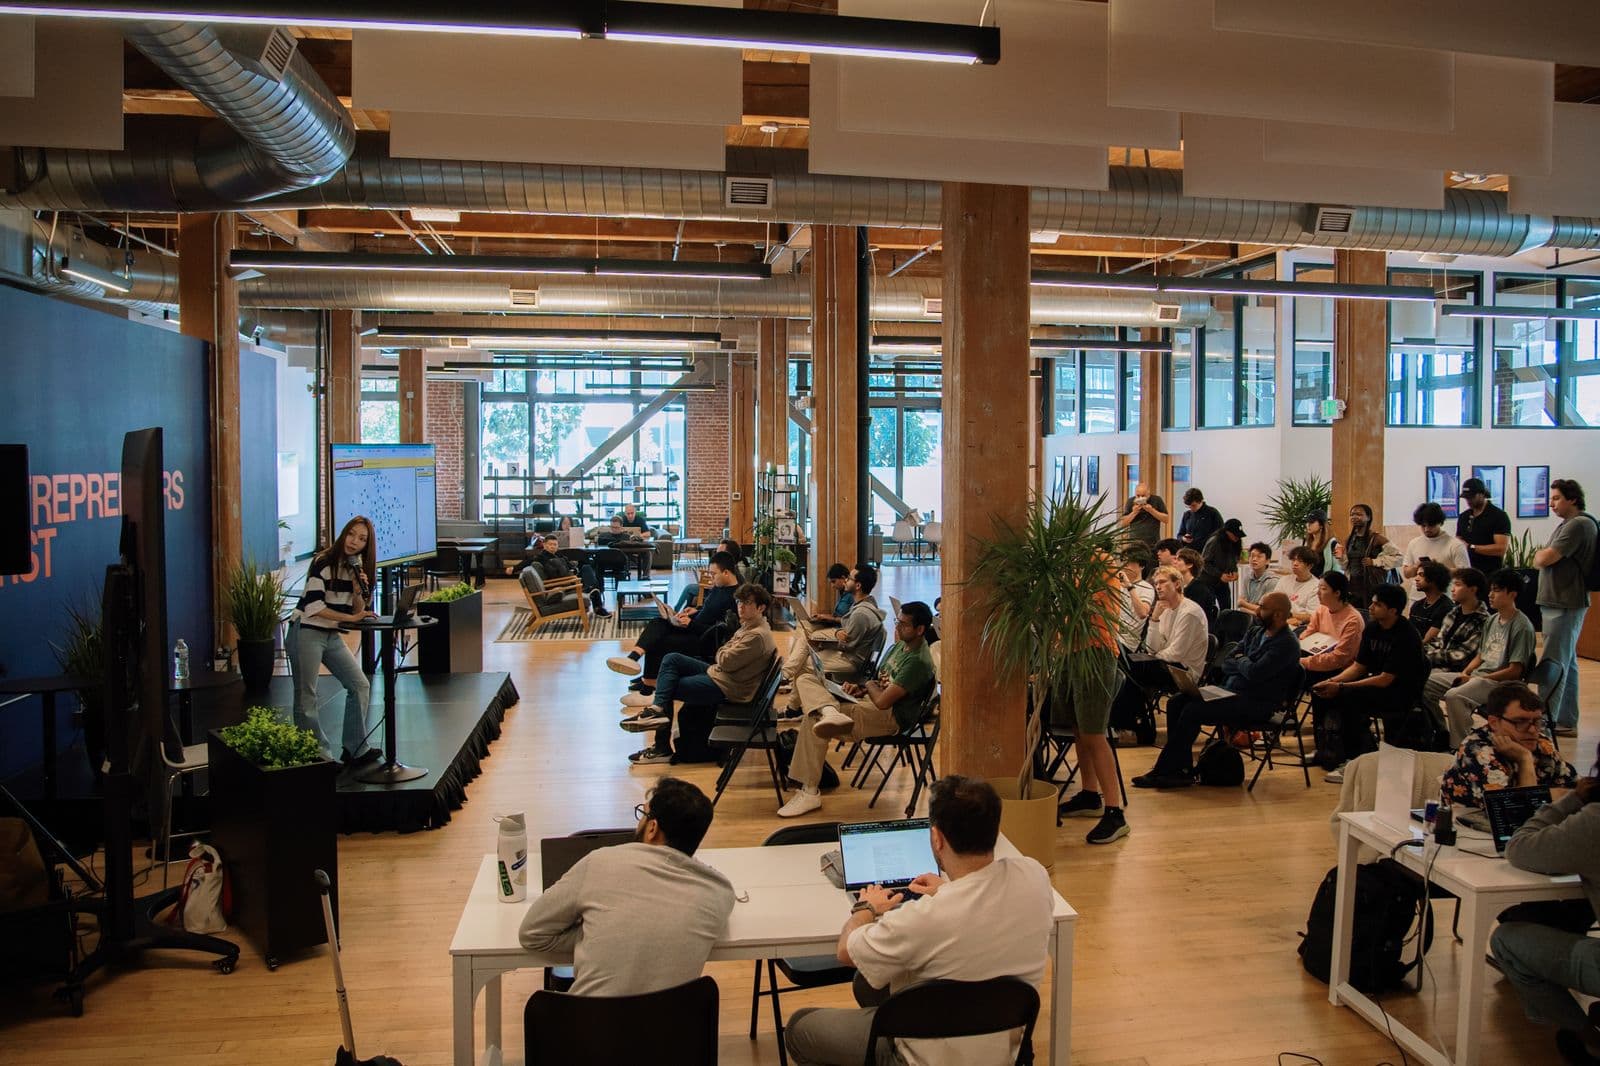
On September 19, I hosted the San Francisco room of Hack for Humanity at Entrepreneurs First. I also gave the technical talk and judged the demos.
I work on FalkorDB (graph DB for agents). Teams had four hours and a new database to learn.
Team after team built the whole project around the graph. After the demos I read every repo, because I wanted to see the code behind what I saw on stage.
Who was in the room
Hack for Humanity ran across up to 130 communities in 52 countries, with more than 20,000 builders. 199 people signed up for my room.
This was not a student crowd. I talked to people who build at Google, Oracle, Meta, and the European Space Agency. The teams behind more than 25 startups were there too. These people choose infrastructure for a living. They gave up a Saturday to work on city hall records, street parking, an endangered language, and neighbors who need a hand.
What I told them in ten minutes
I built my talk around one question. How much is a mouse?
Vector search looks for things close to a mouse. It finds a rat, a hamster, cheese, and a cat. None of those is a price. A graph stores the mouse, a price link, and $25, so it follows the link and answers. The line I wanted the room to keep was "Similar is not the same as connected."
Then I ran a live demo on the Marvel universe, stored as about 2,000 things and 3,600 links. I asked each question twice with the same model, once alone and once with the graph. The last question was a trap. Which Guardian of the Galaxy has used the Time Stone? Nobody has, so the graph has no such link, and the agent said nobody.
That trap was the point. This room was building for shelters, clinics, and real people. For them, "I don't know" beats a confident wrong answer.
You can watch the demo here. I ended with a simple offer. I'm here all day, so if you get stuck, come find me.
Three projects that stood out
Board of SuperVision, by Kieran Batchelli-Hennessey. San Francisco's Board of Supervisors makes its decisions in public, then leaves them in hours of video that almost nobody watches. Kieran turned 66 of those meetings into one graph of 7,553 nodes and 6,961 recorded votes. Every answer links to the moment in the video.
I keep coming back to one query. It asks who dissents together. Votes are edges, so the question is one pattern:
MATCH (a:Supervisor)-[:VOTED {vote: 'no'}]->(i:Item)
      <-[:VOTED {vote: 'no'}]-(b:Supervisor)
WHERE a.name < b.name
No vector index can answer that, because the answer does not live in any one piece of text. Kieran's README calls the answers "traversals over the record, not guesses from similar-looking text."
The safety work impressed me as much as the query. Every read is read-only with a 3 second timeout. A guard caps results at 100. The UI shows the exact query it just ran. The eval set passes 30 of 30. People who have shipped before build like this, even with a clock running.
Can I park here?, by Henry Gardner. Henry won Best Use of Photon. You text a map pin to an iMessage bot, and it tells you if you can stay and when you must move. Henry loaded about 22,500 curb segments and 37,700 street-sweeping entries from the city's open data. When your spot is blocked, one query finds the open curbs nearby.
Then I read the import code. Each graph gets a name from a hash of its data, and a flag flips only when the load is done. The bot can never read a half-loaded graph.
LOCAL GACHA, by Ryotaro Mizuno. Crowds fill the same ten streets in Tokyo while family shops a few blocks away get nothing. Ryotaro built a 3D capsule machine that sends visitors to real local spots. A two-hop query picks the next stop and returns what the two spots share, so the card can say why you should go. The model only writes the guide text from rows the graph returned. It has no database access. The dataset is five venues, and the instinct is right at any size.
What I took from it
Every team chose its own problem and stack. I still found the same pipeline in almost every repo:
- Raw material goes in, like a photo, a text message, or meeting video.
- A model reads it and writes typed facts.
MERGEturns the facts into nodes and edges, so the import can run twice safely.- A read-only query with a timeout walks the relationships.
- The answer comes back with its evidence.
The model suggests. A read-only query decides. We recommend these habits for agents, and these teams reached them on their own in four hours.
The person on the other end is a renter or a tourist who will act on the reply. Several teams built for that.
Other projects from my room deserve a look too. SF Civic Lens by Jessie Cui turns a street photo into a 311 ticket with an audit trail. Postscript by Aspen Ma and Anup Mantri models a patient's after-visit summary as a graph. WildSignal by Sunny Rodrigues reports wildlife encounters over iMessage. Rimai by William Santos translates between Inga and Spanish, shows the source behind every word, and improves when speakers correct it. See all 15 projects.
Thank you to Google Gemini, Photon, and Entrepreneurs First, and to everyone who spent a Saturday building for someone else.
I wrote the full technical recap, with every stack and query, for the company blog: How builders at Hack for Humanity used FalkorDB (graph DB for agents).